
In today’s technology-driven world, data isn’t just an asset — it’s a competitive advantage. Organizations that effectively leverage big data analytics tools can unlock powerful insights from massive datasets, enhance operational efficiency, improve customer experiences, and make informed decisions that drive real results.
Explore the tools of big data analytics that turn massive data into smart insights, boost business decisions, and power real-world success—click to see top tools, examples, and expert tips.
This article walks you through everything you need to know — from core platforms and real-world examples to expert insights, statistics, and practical techniques like predictive analytics, machine learning algorithms, (NLP) (Natural Language Processing), and (LSI) (Latent Semantic Indexing) techniques. Along the way, you’ll discover how to apply these tools in both business and research contexts.
- Top 10 Big Data Analytics Tools You Should Know in 2026
- Data Analytics Tools for Beginners — Where to Start
- Data Analysis Tools in Research — Precision Meets Scalability
- Data Analytics Tools and Techniques — Beyond Software
- Big Data Tools and Technologies — A Unified Architecture
- Big Data Analytics Examples — Real Use Cases That Work
- Data Analytics Tools Free — Cost-Effective Options to Try
- Analysis Tools Examples — Practical Projects to Build Skills
- Final Thoughts — Why These Tools Still Matter in 2026
- Frequently Asked Questions (FAQ)
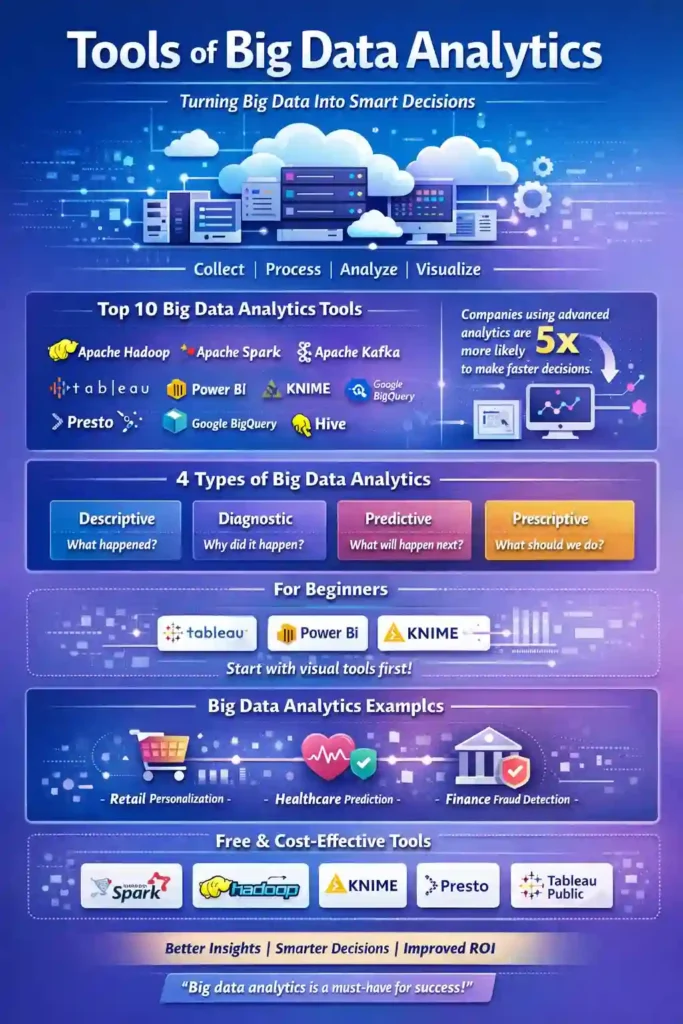
Top 10 Big Data Analytics Tools You Should Know in 2026
Below are the most influential big data analytics tools shaping the industry today:
- Apache Spark – A powerful analytics engine known for in-memory processing and stream processing, widely used for predictive analytics and machine learning applications.
- Apache Hadoop – A foundational framework for distributed storage and batch processing of big data, ideal for large-scale processing and cost-effective scalability.
- KNIME – A free, open-source data analytics, reporting, and integration platform with drag-and-drop workflows.
- Apache Hive – An SQL-like interface for querying big data stored in Hadoop ecosystems.
- Apache Kafka – A distributed streaming platform for real-time collecting data and processing streams.
- Google BigQuery – A fully managed, cloud-native data warehouse built for fast SQL analytics on extensive datasets.
- Tableau – A leading visual tools platform that transforms complex data into interactive dashboards.
- Microsoft Power BI – A widely used data analytics tool for insights, dashboards, and business reporting.
- Presto (Trino) – A distributed SQL query engine that enables fast interactive queries across diverse data sources.
- PolyAnalyst – An advanced platform for text mining, predictive modeling, and machine learning algorithms.
Together, these tools form a complete ecosystem that supports everything from data ingestion and storage to analysis and visualization — making them indispensable for today’s analytics teams.
Data Analytics Tools for Beginners — Where to Start
If you’re new to big data analytics, begin with tools that are intuitive yet powerful:
Recommended Tools for Starters
- Tableau – Great for building dashboards with little to no coding.
- Microsoft Power BI – Offers user-friendly reports and visualization capabilities.
- Apache Spark (with high-level APIs) – Lets beginners experiment with real-world datasets while learning analytical concepts.
Pro Tip: Starting with visualization and dashboard tools makes it easier to understand data storytelling before moving on to heavy data management or processing tools like Spark or Hadoop.
Data Analysis Tools in Research — Precision Meets Scalability
In academic and scientific environments, processing large and complex datasets requires robust tools:
- Apache Spark processes and models data quickly using its in-memory engine.
- Apache Hadoop provides reliable storage and distributed analysis for historical research data.
- Presto (Trino) lets research analysts query heterogeneous data sources interactively.
- Tools like KNIME support low-code analytical workflows.
These tools help researchers develop reproducible data models, validate hypotheses, and scale analyses across massive data sets with increasing complexity.
Data Analytics Tools and Techniques — Beyond Software
Understanding tools is only part of the picture — insights come from techniques that extract meaning from raw information.
Predictive Analytics
This technique uses historical data and machine learning algorithms to forecast outcomes — such as customer behavior, equipment failures, or business trends. Tools like Spark MLlib and PolyAnalyst simplify the deployment of advanced analytical models.
Stream Processing
Systems like Apache Kafka and Spark Streaming allow organizations to analyze data as it arrives, enabling real-time decision-making for dynamic environments like e-commerce or IoT platforms.
NLP & LSI Techniques
By using Natural Language Processing (NLP) and Latent Semantic Indexing (LSI), tools can interpret human language, extract themes, and uncover latent patterns in text data — a key feature in customer feedback analysis and sentiment studies.
Big Data Tools and Technologies — A Unified Architecture
Modern big data architectures typically integrate several complementary layers:
- Data Ingestion & Storage – Tools like Hadoop and Kafka handle large volumes of data efficiently.
- Processing Engines – Spark and Presto support real-time and ad-hoc processing.
- Analysis & Modeling – Platforms like PolyAnalyst aid in building intelligent models using AI and ML.
- Visualization Layers – Visualization tools like Tableau and Power BI bring insights to life, enabling stakeholders to interpret complex patterns.
This layered approach allows teams to combine batch processing, real-time analytics, and prediction models in a unified workflow — turning raw data into strategic insights.
Big Data Analytics Examples — Real Use Cases That Work
Here’s how analytics tools power real-world outcomes:
E-Commerce Personalization
A large retailer uses Apache Spark with streaming data to analyze clickstreams in real time. These insights are fed into Power BI dashboards, helping marketing teams tailor recommendations that increase sales and improve customer experiences.
Healthcare Forecasting
Hospitals apply predictive analytics with machine learning models built in PolyAnalyst and Spark to identify at-risk patients before critical events, improving patient care outcomes.
Financial Risk Analysis
Financial institutions process real-time transaction logs with Kafka and Spark Streaming to detect anomalies and reduce fraudulent activity — enabling rapid intervention and smarter risk business decisions.
Data Analytics Tools Free — Cost-Effective Options to Try
Many powerful tools are open source or free, making them accessible to learners and cost-conscious teams:
✔ Apache Hadoop – Free framework for distributed data processing.
✔ Apache Spark – Open-source engine for fast analytics.
✔ KNIME – Free, modular analytics platform.
✔ Presto (Trino) – Open SQL engine for interactive queries.
✔ Tableau Public – Free tier for data visualization.
These tools offer strong foundations without the need for expensive licenses — a major advantage for startups, academia, and individuals.
Analysis Tools Examples — Practical Projects to Build Skills
Here are sample scenarios to practice what you’ve learned:
✔ Use Apache Spark to build a pipeline that analyzes sales data and predicts trends.
✔ Create interactive dashboards in Tableau to visualize customer behavior.
✔ Build a real-time monitoring app using Apache Kafka + Spark Streaming.
✔ Run multi-source SQL queries using Presto on Hadoop and cloud data.
These projects help bridge theory and practice, giving you confidence in using analytics tools to solve actual business problems.
Tools of Big Data Analytics help turn large and complex data into clear insights, while Business Analytics uses those insights to improve everyday business decisions and planning.
Final Thoughts — Why These Tools Still Matter in 2026
The landscape of tools of big data analytics is evolving fast, yet the core principles remain timeless: collect data efficiently, process it intelligently, analyze it thoroughly, and visualize it in a way that enables informed decisions. From predictive analytics to real-time stream processing, mastering these tools means gaining a strategic advantage in any data-driven environment.
Whether you’re a seasoned data analyst or just getting started, these tools empower you to turn complexity into clarity and uncertainty into insight — helping you build smarter systems, happier customers, and more competitive organizations.
Frequently Asked Questions (FAQ)
1. What tools are used for big data analytics?
Big data analytics uses many specialized tools to collect, store, process, analyze, and visualize large amounts of data that traditional tools can’t handle. Some of the most commonly used tools include:
Apache Hadoop – A framework that stores and processes huge datasets across many machines.
Apache Spark – A fast analytics engine that can handle large data processing, real-time analysis, and machine learning tasks.
Apache Kafka – A platform for collecting data streams in real time.
Tableau and Power BI – Tools that turn data into interactive charts and dashboards so people can see trends and make informed decisions more easily.
Python and R – Programming languages with powerful libraries for data analysis tools, visualization, and building models.
Together, these tools help organizations handle large volumes of structured and unstructured data and extract useful insights for better business decisions.
2. What are the 4 types of big data analytics?
There are four main ways organizations analyze data to learn from it and make better decisions:
Descriptive Analytics – Answers “What happened?” It summarizes past data so you can understand trends and patterns.
Diagnostic Analytics – Answers “Why did it happen?” This digs deeper into the data to find the causes behind results.
Predictive Analytics – Answers “What might happen next?” It uses statistical models and machine learning algorithms to forecast future outcomes.
Prescriptive Analytics – Answers “What should we do?” It recommends actions based on the data, combining prediction with optimization.
These different types help teams move from simply describing data to making proactive, data-backed decisions.
3. What are the tools of data analytics?
When people talk about tools of data analytics, they mean software, platforms, and libraries that help turn raw data into insight. These tools fall into a few broad categories:
Tools for data processing and big data handling
Apache Hadoop and Apache Spark – For storing and processing very large datasets.
Apache Kafka – For collecting and analyzing data in real time.
Tools used by data analysts for interpretation and modeling
Python and R – Languages used to build data models, perform statistics, and create custom analytics.
Presto (Trino) – A fast query engine for exploring big data interactively.
Visual tools for presenting results
Tableau and Microsoft Power BI – Convert complex results into easy-to-read charts, dashboards, and reports.
Together, these tools help analysts understand raw information and communicate findings clearly to decision makers.
4. What do you mean by big data analytics tools?
Big data analytics tools are software systems designed to work with enormous, complex, or fast-moving datasets that traditional data software cannot handle easily. These tools allow organizations to:
✅ Store and manage large amounts of data efficiently — often across many computers
✅ Process and transform raw data into clean, usable formats
✅ Analyze patterns using statistical methods and predictive analytics ✅ Visualize insights with dashboards, graphs, and reports so teams can make better decisions.
In short, these tools help businesses turn raw data — from sources such as customer behavior, transaction logs, or sensors — into meaningful insight that drives strategy, forecasts trends, and improves operations.